1. Background
In our payment system, thread pools play a critical role in batch payment processing. As transaction volume grew, the payment endpoint’s throughput degraded to the point where a single batch could take over 5 minutes — unacceptable for the calling services. The obvious fix is to increase the thread count and queue capacity, but figuring out the right numbers without over-provisioning is hard to do by feel alone. Prometheus + Grafana is a well-established monitoring stack, and it works well for thread pool observability too.
2. Thread Pool Configuration
The configuration uses Spring’s ThreadPoolTaskExecutor. Based on the business requirements, two pools are defined: a synchronous pool and an asynchronous pool.
1 |
|
3. Monitoring Metrics
Combining the core thread pool parameters with the operational metrics that matter for production, here are the gauges to expose:
- Core pool size
- Max pool size
- Active thread count
- Current pool size
- Queued task count
Completed task count
1
2
3
4
5
6
7
8
9
10
11
12
13
14
15
16
17
18
19
20
21
22
23
24
25
26
27
28
29
30
31
32
33
34
35
36
37
38
39
40
41
42
43
44
45
46
47
48
49
50
51
52
53
54
55
56
57
58
59
60
61
62
63
64import io.micrometer.core.instrument.Gauge;
import io.micrometer.core.instrument.MeterRegistry;
import io.micrometer.core.instrument.Metrics;
public class ExecutorMetricsSupport implements InitializingBean {
/**
* Prometheus metric collection registry
*/
private MeterRegistry meterRegistry;
(SYNC_EXECUTOR)
private ThreadPoolTaskExecutor syncExecutor;
(ASYNC_EXECUTOR)
private ThreadPoolTaskExecutor asyncExecutor;
public void afterPropertiesSet() throws Exception {
initServiceExecutorMetrics(syncExecutor, "executor.sync");
initServiceExecutorMetrics(asyncExecutor, "executor.async");
}
/**
* Register thread pool metrics
* @param serviceExecutor the thread pool
* @param namePrefix metric name prefix
*/
private void initServiceExecutorMetrics(ThreadPoolTaskExecutor serviceExecutor, String namePrefix) {
Gauge
.builder(namePrefix.concat(".active"),
serviceExecutor, ThreadPoolTaskExecutor::getActiveCount)
.register(meterRegistry);
Gauge
.builder(namePrefix.concat(".core"),
serviceExecutor, ThreadPoolTaskExecutor::getCorePoolSize)
.register(meterRegistry);
Gauge
.builder(namePrefix.concat(".max"),
serviceExecutor, ThreadPoolTaskExecutor::getMaxPoolSize)
.register(meterRegistry);
Gauge
.builder(namePrefix.concat(".pool"),
serviceExecutor, ThreadPoolTaskExecutor::getPoolSize)
.register(meterRegistry);
Gauge
.builder(namePrefix.concat(".queue"), serviceExecutor,
executor -> executor.getThreadPoolExecutor().getQueue().size())
.register(meterRegistry);
Gauge
.builder(namePrefix.concat(".completetask"), serviceExecutor,
executor -> executor.getThreadPoolExecutor().getCompletedTaskCount())
.register(meterRegistry);
}
}
4. Metric Analysis
These metrics are visualized in Grafana via Prometheus. Prometheus defaults to a 15-second scrape interval, but for something as volatile as a thread pool, 10 seconds gives a more responsive and accurate picture.
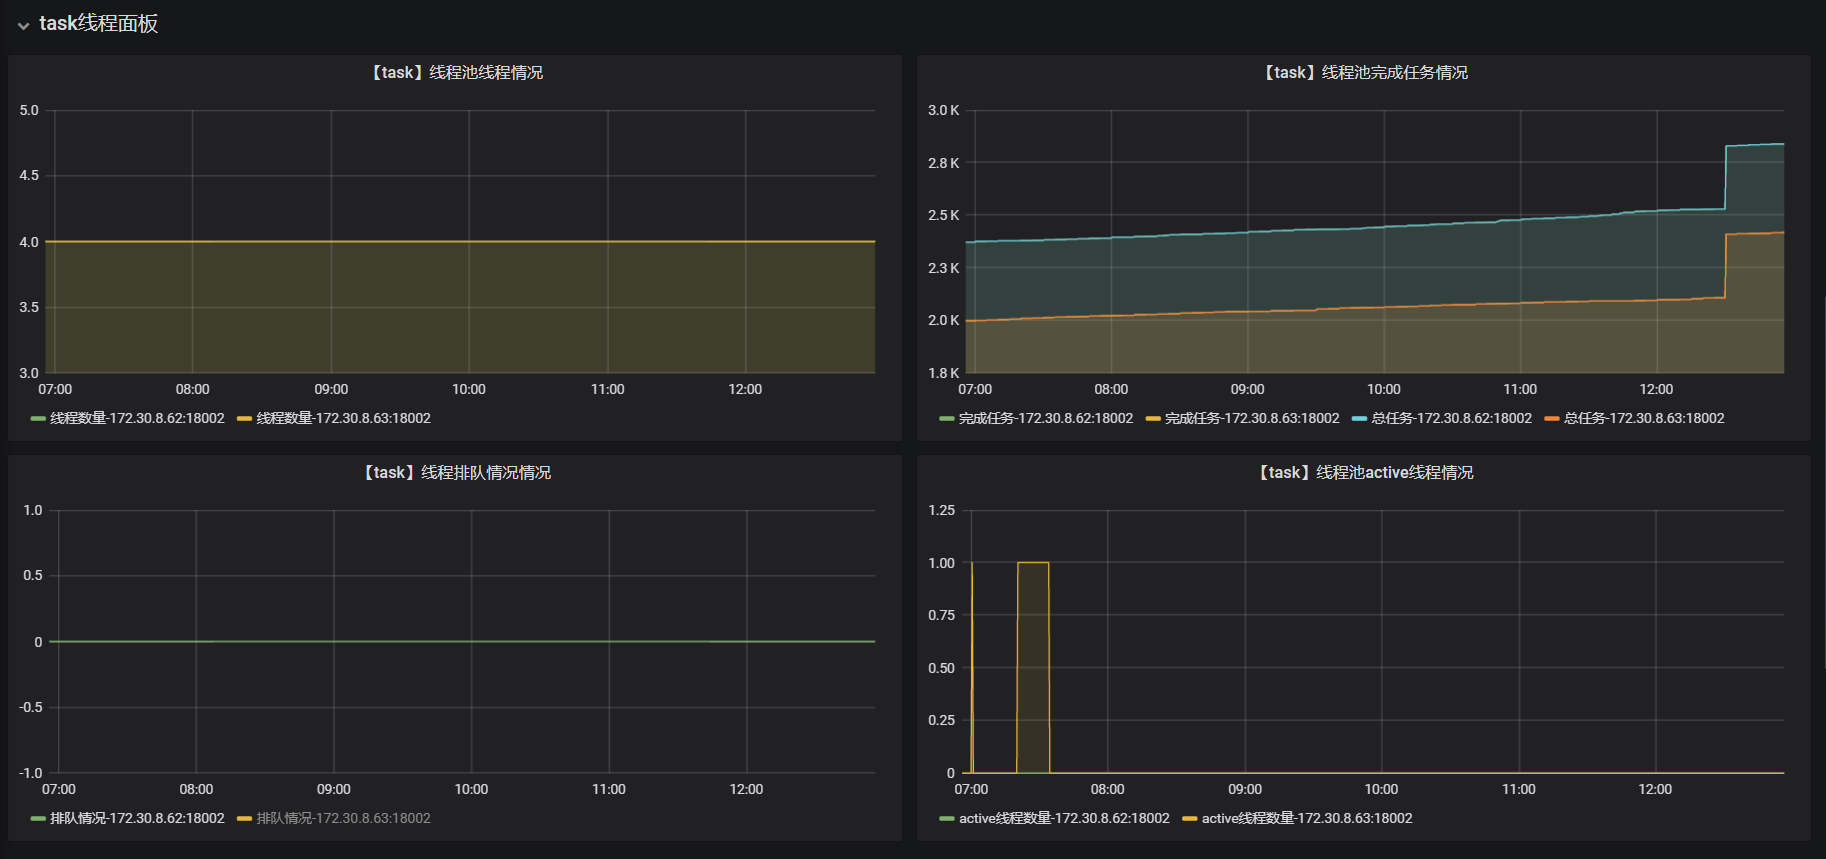
- Async thread pool
- Sync thread pool
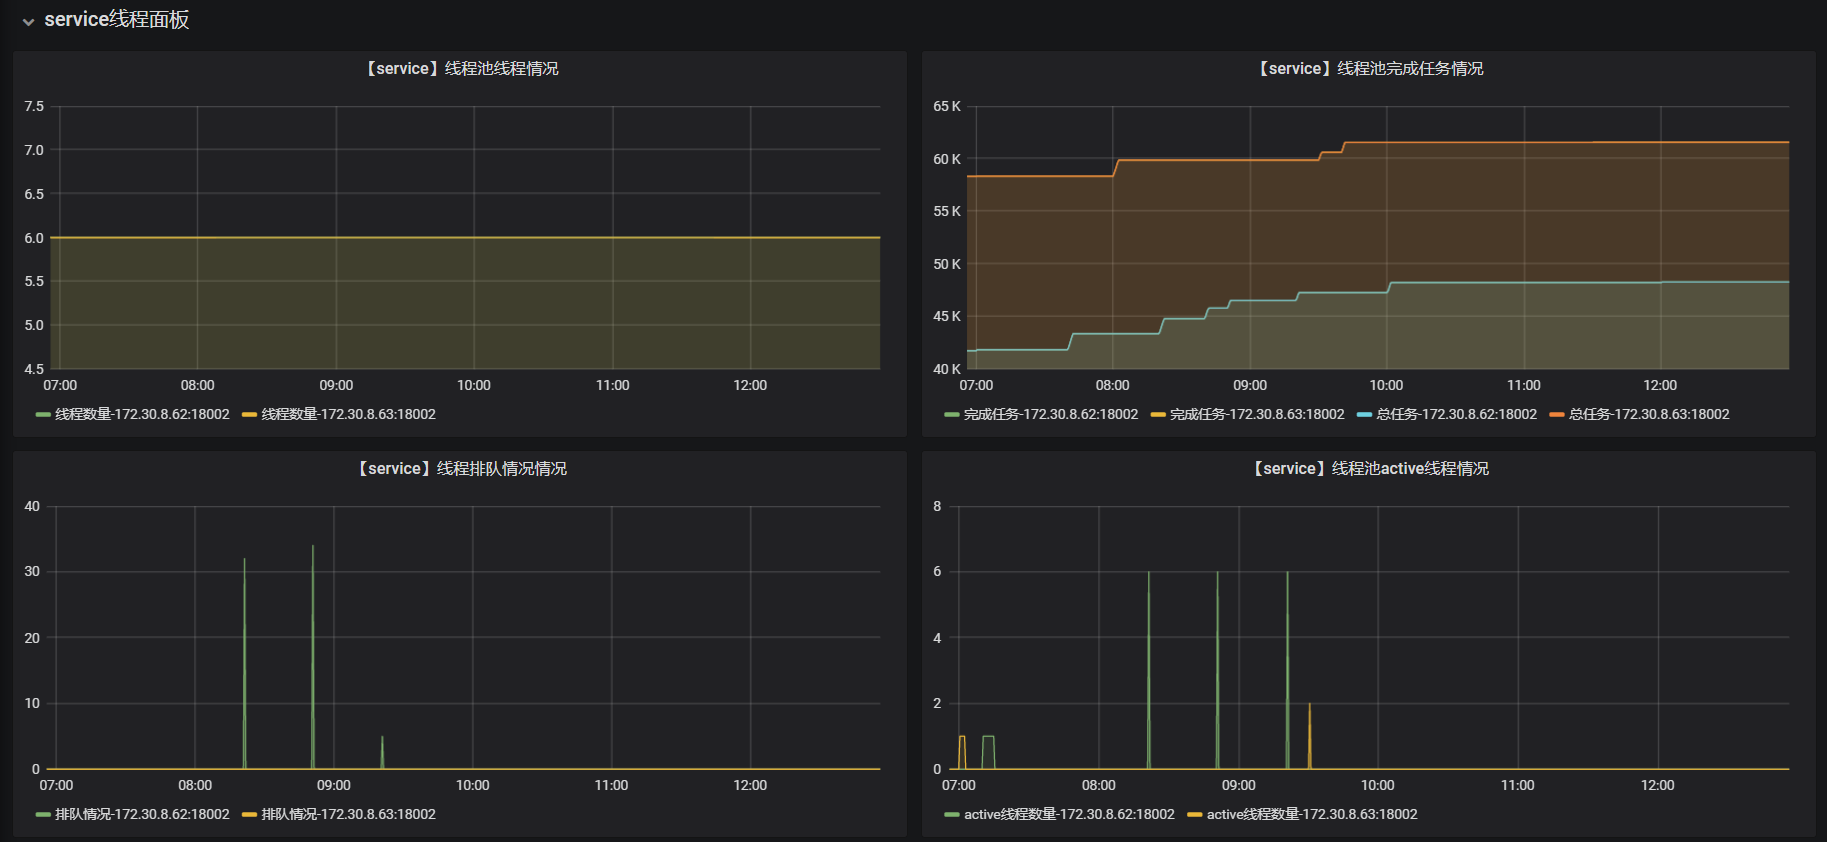
The monitoring data tells a clear story:
- The async pool is lightly loaded — no queue backlog has ever appeared, and both the core and max thread counts could be reduced.
- The sync pool configuration is well-tuned: non-core threads were never activated during peak load, the queued task count stayed within a reasonable range, and request processing throughput remained high.