一、应用背景
在支付系统中,线程池在批量支付中有着十分重要的作用。随着业务量的增多,支付接口的处理能力越来越弱,甚至出现一个支付批次的处理时间超过5分钟的情况。这对于调用方来说,是无法容忍的。最简单粗暴的解决办法,便是增加线程数和阻塞队列容量。但至于怎么调整,才能做到既保证接口对支付请求的处理能力,又不浪费系统资源,好像只能凭感觉来了。Prometheus + Grafana 是目前比较流行的监控体系,在管理线程池方面的表现也十分出色。
二、线程池配置
采用 Spring 提供的 ThreadPoolTaskExecutor 来完成线程池的配置。根据业务需要,创建两个线程池:同步线程池和异步线程池。具体配置如下:
1 |
|
三、监控指标
综合线程池的核心要素和生产业务的关键要素,提出以下几种监控指标:
- 核心线程数;
- 最大线程数;
- 活跃线程数;
- 当前线程数;
- 队列中任务数;
已完成任务数;
1
2
3
4
5
6
7
8
9
10
11
12
13
14
15
16
17
18
19
20
21
22
23
24
25
26
27
28
29
30
31
32
33
34
35
36
37
38
39
40
41
42
43
44
45
46
47
48
49
50
51
52
53
54
55
56
57
58
59
60
61
62
63
64import io.micrometer.core.instrument.Gauge;
import io.micrometer.core.instrument.MeterRegistry;
import io.micrometer.core.instrument.Metrics;
public class ExecutorMetricsSupport implements InitializingBean {
/**
* Prometheus 数据采集中心
*/
private MeterRegistry meterRegistry;
(SYNC_EXECUTOR)
private ThreadPoolTaskExecutor syncExecutor;
(ASYNC_EXECUTOR)
private ThreadPoolTaskExecutor asyncExecutor;
public void afterPropertiesSet() throws Exception {
initServiceExecutorMetrics(syncExecutor, "executor.sync");
initServiceExecutorMetrics(asyncExecutor, "executor.async");
}
/**
* 线程池metrics指标监控
* @param serviceExecutor 线程池
* @param namePrefix 指标名称前缀
*/
private void initServiceExecutorMetrics(ThreadPoolTaskExecutor serviceExecutor, String namePrefix) {
Gauge
.builder(namePrefix.concat(".active"),
serviceExecutor, ThreadPoolTaskExecutor::getActiveCount)
.register(meterRegistry);
Gauge
.builder(namePrefix.concat(".core"),
serviceExecutor, ThreadPoolTaskExecutor::getCorePoolSize)
.register(meterRegistry);
Gauge
.builder(namePrefix.concat(".max"),
serviceExecutor, ThreadPoolTaskExecutor::getMaxPoolSize)
.register(meterRegistry);
Gauge
.builder(namePrefix.concat(".pool"),
serviceExecutor, ThreadPoolTaskExecutor::getPoolSize)
.register(meterRegistry);
Gauge
.builder(namePrefix.concat(".queue"), serviceExecutor,
executor -> executor.getThreadPoolExecutor().getQueue().size())
.register(meterRegistry);
Gauge
.builder(namePrefix.concat(".completetask"), serviceExecutor,
executor -> executor.getThreadPoolExecutor().getCompletedTaskCount())
.register(meterRegistry);
}
}
四、指标分析
通过 PSQL 将以上各项指标展示在 Grafana 中。 Prometheus 默认 15s 拉取一次数据,对于线程池这种波定性较大的指标,建议将拉取时间调整至 10s,以便灵活且准确地反应线程池的运行情况。
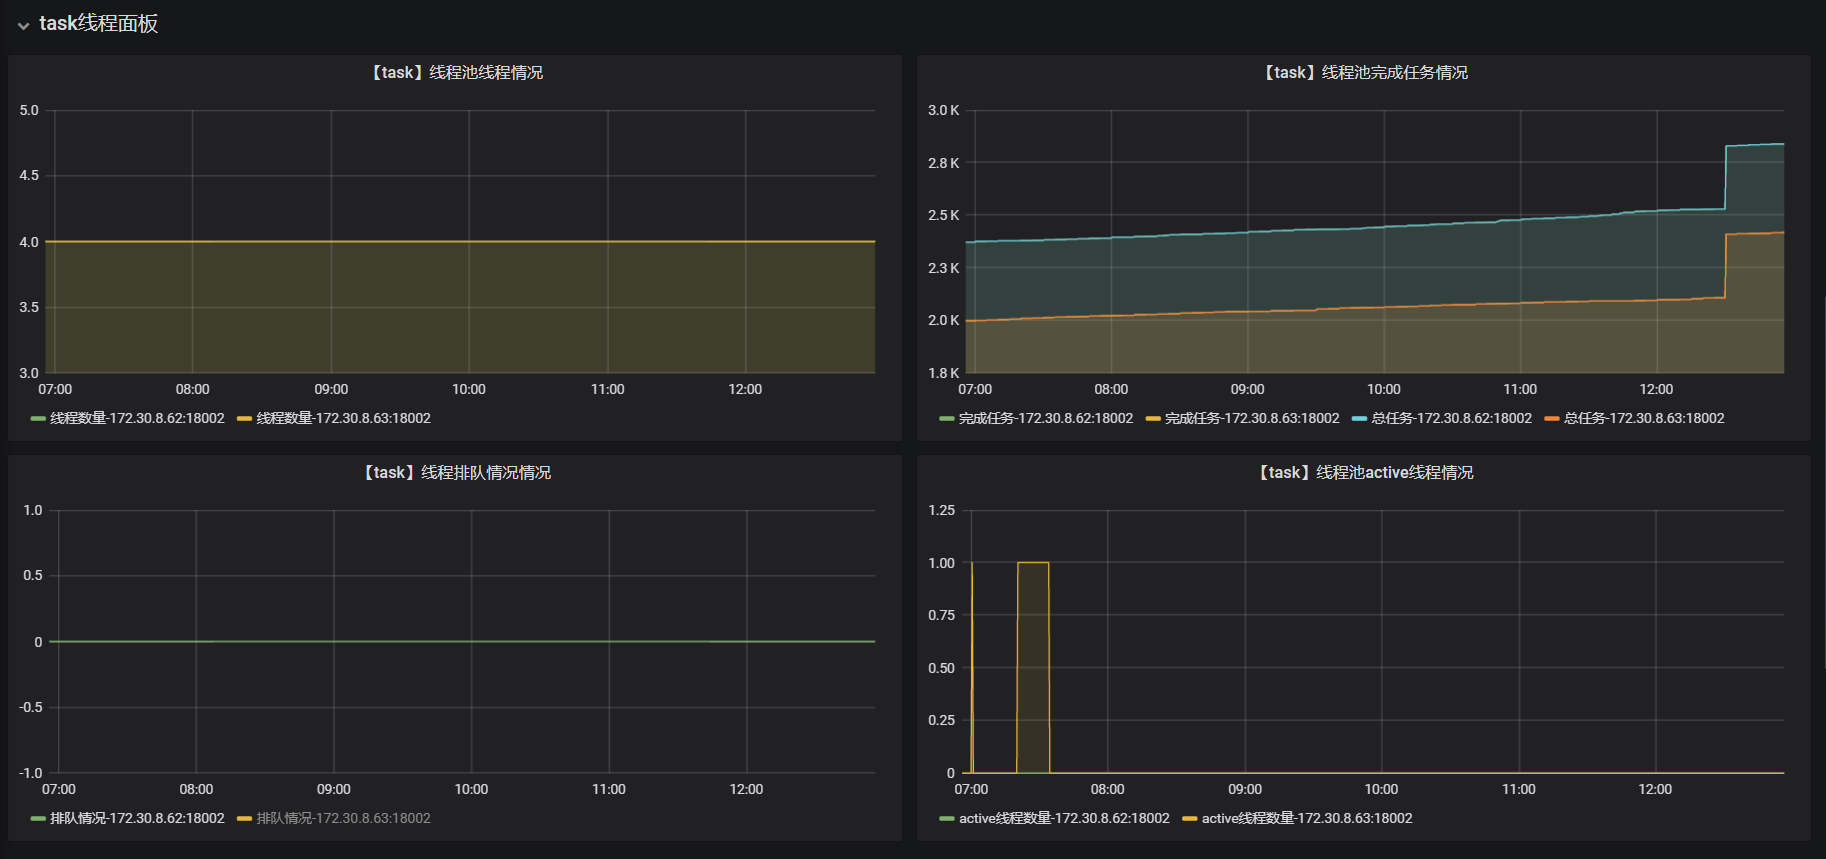
- 异步线程池
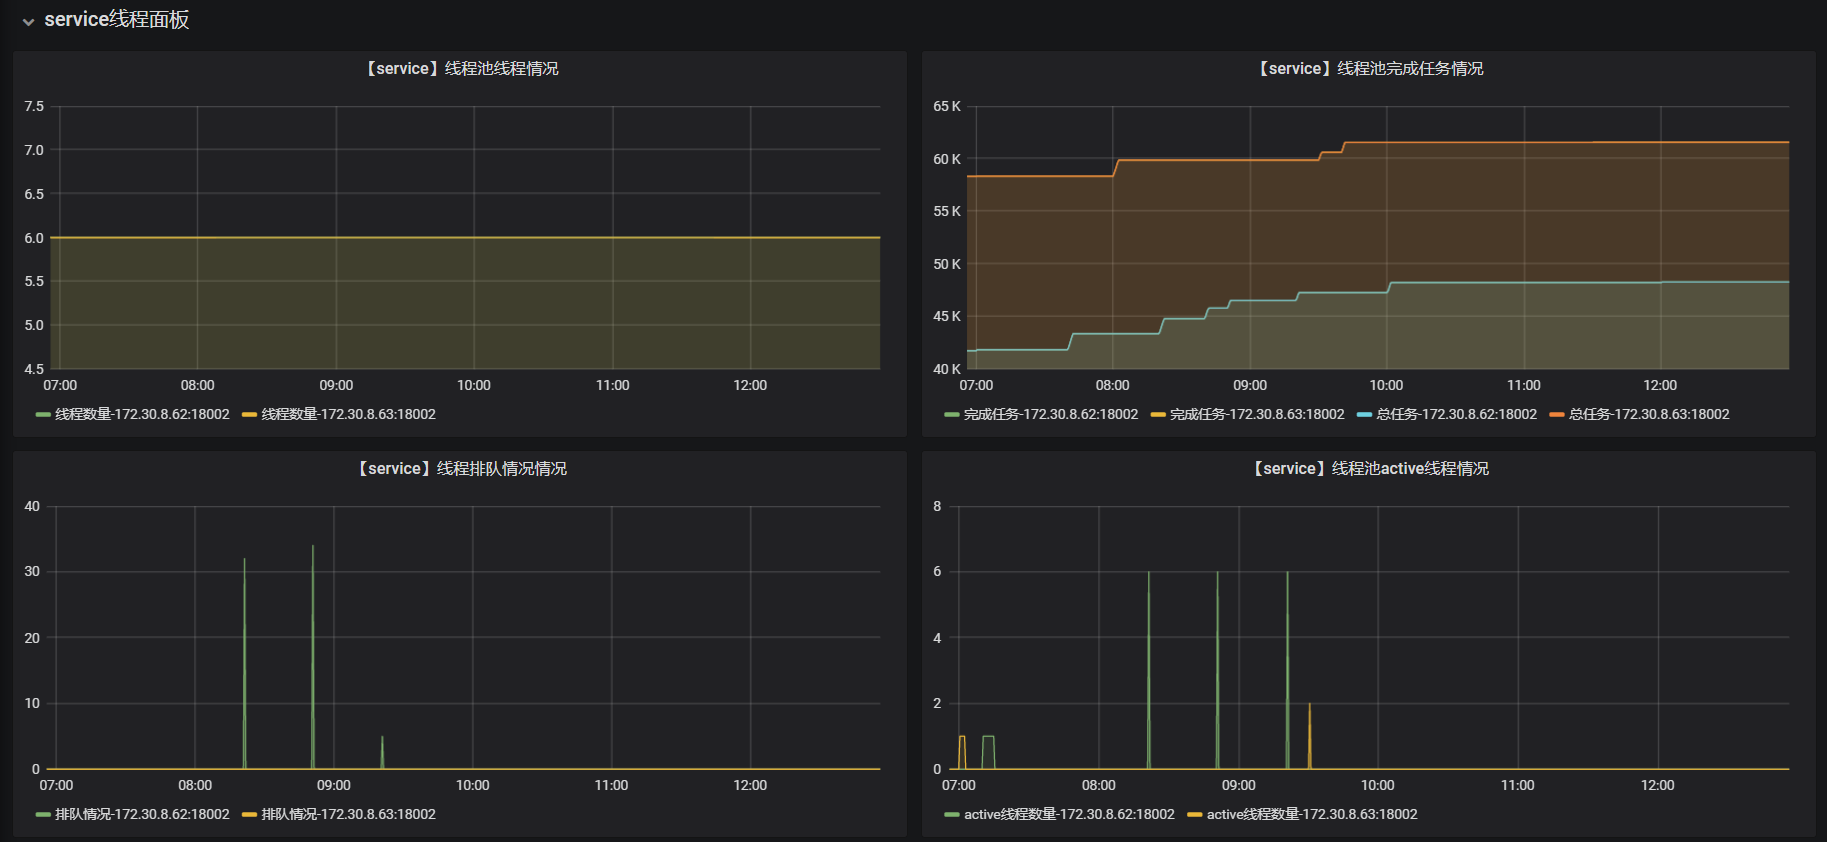
- 同步线程池
由监控结果可以作出以下分析:
- 异步线程池的负担非常小,目前还没出现过队列积压的情况,可以适当减少核心线程和最大线程数;
- 同步线程池配置较为妥当,峰值期间未启用非核心线程,队列积压任务量在合理区间,请求处理效率非常高。